Mixer中内置了Prometheus适配器,这一适配器将生成的指标值以端点的形式公开出来;Prometheus插件则是一个预配置的Prometheus服务器,它除了从上述Mixer端点抓取Istio指标外,还为Istio指标提供了持久化存储和查询的服务。
配置完的Prometheus插件会抓取以下端点的指标数据:
·istio-telemetry.istio-system:42422:istio-mesh作业返回所有Mixer生成的指标。
·istio-telemetry.istio-system:9093:istio-telemetry作业返回所有特定于Mixer的指标。使用此端点监视Mixer本身。
·istio-proxy:15090:envoy-stats作业返回由Envoy生成的原始统计数据。Prometheus会查找envoy-prom端点暴露的pod,在收集过程中过滤掉大量Envoy的指标数据,这样是为了限制数据规模。
·istio-pilot.istio-system:9093:pilot作业返回Pilot生成的指标。
·istio-galley.istio-system:9093:galley作业返回Galley生成的指标。
·istio-policy.istio-system:9093:istio-policy作业返回所有与策略相关的指标。
为了使用Prometheus查询Istio指标,我们首先在安装了Istio的Kubernetes集群中部署应用程序。此外,必须在安装了Istio的Kubernetes集群中安装Prometheus附加组件。
1.部署应用示例
仍然使用前面章节中使用的httpbin与sleep服务作为应用示例,运行以下命令部署应用示例:
$ cd mixer/prom-adapter
$ kubectl create -f httpbin.yaml
$ kubectl create -f sleep.yaml
$ kubectl create -f destination-rule.yaml
$ kubectl create -f virtual-service-80-20.yaml
2.向示例应用发送请求
登录到sleep容器中,执行curl命令发送请求,如下所示:
curl http://httpbin:8000/get
3.查看新指标的生成和收集情况
在Kubernetes环境中,使用下面的命令为Prometheus设置端口转发:
kubectl -n istio-system port-forward $(kubectl -n istio-system get pod -l app=prometheus -o jsonpath='{.items[0].metadata.name}') 9090:9090
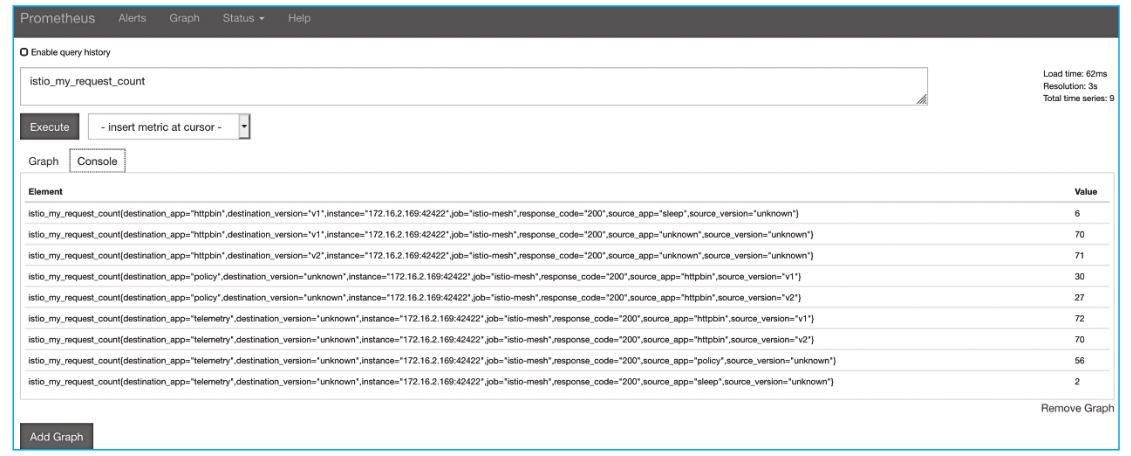
使用Prometheus界面查看新的指标,打开Prometheus界面并查询istio_my_request_count的值,Console标签页会以表格形式进行数据展示,如图8-5所示。
图8-5 使用Prometheus界面查看新的指标
或者切换到Graph标签页进行图形展示,如图8-6所示。
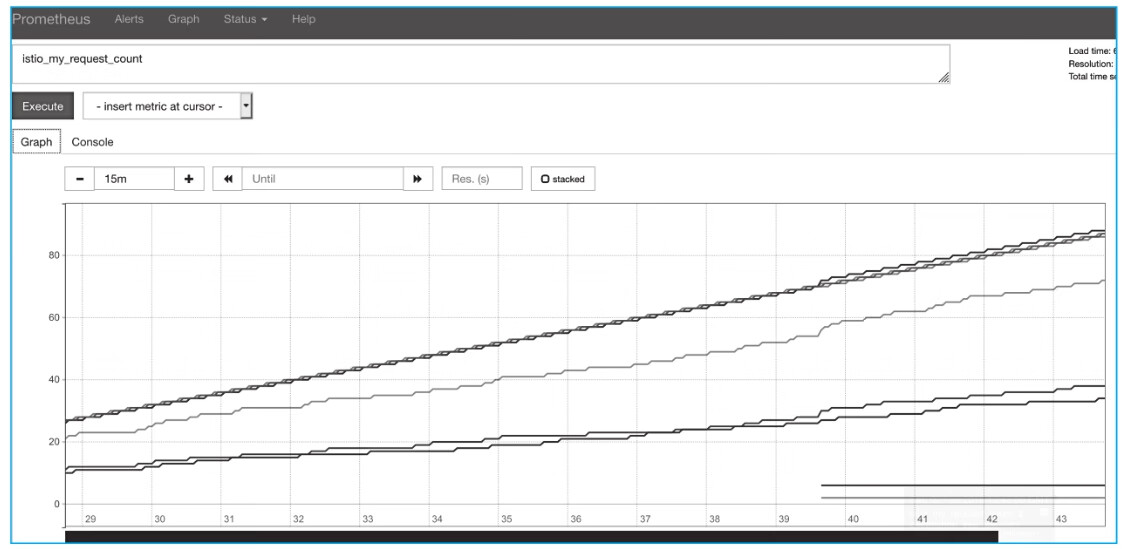
图8-6 切换到Graph标签页进行图形展示
当然也可以查询更多的其他指标数据,可以对以istio开头的指标名称进行查询。