在微服务弹性设计架构中,假设请求某个服务节点时遭遇请求失败,例如请求超时、连接超时、服务宕机等一系列可能的错误,这时可以通过配置重试机制,重新请求其他服务。
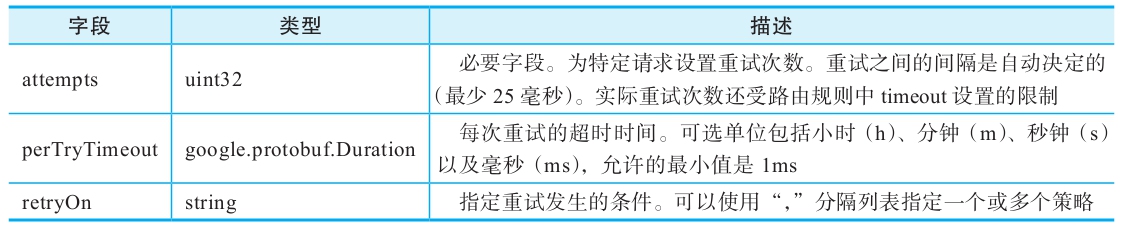
Istio虚拟服务提供了用于定义HTTP请求失败时的重试策略。例如,前面的示例中对service1的流量进行了重试设置,最大重试测试为3,每次重试的超时时间为20秒钟。当返回的状态码是503时,会尝试3次访问。重试策略的配置参见表6-9。
表6-9 重试策略的配置
具体来说,retryOn指定了重试发生的条件,这些与x-envoy-retry-on和x-envoy-retry-grpc-on记录的条件相同,分别定义如下:
·retryOn指定了重试发生的条件。
·numRetries指定允许的重试次数。此参数是可选的,默认为1。这些是x-envoy-max-retries记录的相同条件。
·perTryTimeout指定每次重试尝试的非零超时时间。此参数是可选的。适用于x-envoy-upstream-rq-per-try-timeout-ms记录的相同条件。
示例如下:
"retryPolicy": {
    "retryOn": "5xx,connect-failure,refused-stream",
    "numRetries": 3,
    "perTryTimeout": "20.000s"
},
 注意
注意
客户端启用了故障注入之后,超时和重试会被忽略。
下面通过一个示例来介绍服务重试。
下载本书所使用的示例代码之后,切换到目录traffic-policy/retry下可以查看所有相关的代码文件。
进入客户端pod并使用Fortio工具来调用service1服务。在没有设置任何重试配置时,如果一个连接发起请求得到的返回状态码是503,就意味着该次请求失败。
首先,与上一节中创建命令空间、部署Fortio服务类似,并确认Fortio POD运行正常:
kubectl create namespace retry
kubectl label namespace retry istio-injection=enabled
kubectl apply -n retry -f app.yaml
kubectl apply -n retry -f fortio-deploy.yaml
FORTIO_POD=$(kubectl get pod -n retry | grep fortio | awk '{ print $1 }')
然后,尝试一下2个并发连接(-c 2),发送20请求(-n 20):
kubectl exec -it -n retry $FORTIO_POD  -c fortio /usr/local/bin/fortio -- load -c 2 -qps 0 -n 20 -loglevel Warning http://service1:5678/transient503
07:41:45 I logger.go:97> Log level is now 3 Warning (was 2 Info)
Fortio 1.0.1 running at 0 queries per second, 4->4 procs, for 20 calls: http://service1:5678/transient503
Starting at max qps with 2 thread(s) [gomax 4] for exactly 20 calls (10 per thread + 0)
07:41:45 W http_client.go:604> Parsed non ok code 503 (HTTP/1.1 503)
07:41:45 W http_client.go:604> Parsed non ok code 503 (HTTP/1.1 503)
07:41:45 W http_client.go:604> Parsed non ok code 503 (HTTP/1.1 503)
07:41:45 W http_client.go:604> Parsed non ok code 503 (HTTP/1.1 503)
07:41:45 W http_client.go:604> Parsed non ok code 503 (HTTP/1.1 503)
07:41:45 W http_client.go:604> Parsed non ok code 503 (HTTP/1.1 503)
07:41:45 W http_client.go:604> Parsed non ok code 503 (HTTP/1.1 503)
07:41:45 W http_client.go:604> Parsed non ok code 503 (HTTP/1.1 503)
07:41:45 W http_client.go:604> Parsed non ok code 503 (HTTP/1.1 503)
Ended after 73.610445ms : 20 calls. qps=271.7
Aggregated Function Time : count 20 avg 0.007041729 +/- 0.002681 min 0.002900315
max 0.013631238 sum 0.14083458
range, mid point, percentile, count
>= 0.00290032 <= 0.003 , 0.00295016 , 5.00, 1
> 0.003 <= 0.004 , 0.0035 , 10.00, 1
> 0.004 <= 0.005 , 0.0045 , 25.00, 3
> 0.005 <= 0.006 , 0.0055 , 45.00, 4
> 0.006 <= 0.007 , 0.0065 , 55.00, 2
> 0.007 <= 0.008 , 0.0075 , 60.00, 1
> 0.008 <= 0.009 , 0.0085 , 75.00, 3
> 0.009 <= 0.01 , 0.0095 , 90.00, 3
> 0.01 <= 0.011 , 0.0105 , 95.00, 1
> 0.012 <= 0.0136312 , 0.0128156 , 100.00, 1
 target 50% 0.0065
 target 75% 0.009
 target 90% 0.01
 target 99% 0.013305
 target 99.9% 0.0135986
Sockets used: 11 (for perfect keepalive, would be 2)
Code 200 : 11 (55.0 %)
Code 503 : 9 (45.0 %)
Response Header Sizes : count 20 avg 115.6 +/- 104.6 min 0 max 211 sum 2312
Response Body/Total Sizes : count 20 avg 324.2 +/- 8.869 min 316 max 334 sum 6484
All done 20 calls (plus 0 warmup) 7.042 ms avg, 271.7 qps
可以看到接近一半的请求返回了状态码503,这跟后端服务随机返回匹配。
下面添加重试机制:
apiVersion: networking.istio.io/v1alpha3
kind: VirtualService
metadata:
  name: service1-retry
spec:
  hosts:
  - service1
  http:
  - route:
    - destination:
        host: service1
    retries:
      attempts: 5
      perTryTimeout: 20s
再次发起请求:
kubectl exec -it -n retry $FORTIO_POD  -c fortio /usr/local/bin/fortio -- load -c 2 -qps 0 -n 20 -loglevel Warning http://service1:5678/transient503
07:50:25 I logger.go:97> Log level is now 3 Warning (was 2 Info)
Fortio 1.0.1 running at 0 queries per second, 4->4 procs, for 20 calls: http://service1:5678/transient503
Starting at max qps with 2 thread(s) [gomax 4] for exactly 20 calls (10 per thread + 0)
07:50:25 W http_client.go:604> Parsed non ok code 503 (HTTP/1.1 503)
Ended after 414.77316ms : 20 calls. qps=48.219
Aggregated Function Time : count 20 avg 0.030772388 +/- 0.05291 min 0.00184909 max 0.212820031 sum 0.61544776
 range, mid point, percentile, count
>= 0.00184909 <= 0.002 , 0.00192455 , 10.00, 2
> 0.002 <= 0.003 , 0.0025 , 35.00, 5
> 0.003 <= 0.004 , 0.0035 , 40.00, 1
> 0.004 <= 0.005 , 0.0045 , 45.00, 1
> 0.008 <= 0.009 , 0.0085 , 50.00, 1
> 0.009 <= 0.01 , 0.0095 , 55.00, 1
> 0.012 <= 0.014 , 0.013 , 60.00, 1
> 0.014 <= 0.016 , 0.015 , 70.00, 2
> 0.018 <= 0.02 , 0.019 , 75.00, 1
> 0.02 <= 0.025 , 0.0225 , 80.00, 1
> 0.05 <= 0.06 , 0.055 , 85.00, 1
> 0.08 <= 0.09 , 0.085 , 90.00, 1
> 0.12 <= 0.14 , 0.13 , 95.00, 1
> 0.2 <= 0.21282 , 0.20641 , 100.00, 1
 target 50% 0.009
 target 75% 0.02
 target 90% 0.09
 target 99% 0.210256
 target 99.9% 0.212564
Sockets used: 3 (for perfect keepalive, would be 2)
Code 200 : 19 (95.0 %)
Code 503 : 1 (5.0 %)
Response Header Sizes : count 20 avg 199.95 +/- 45.88 min 0 max 212 sum 3999
Response Body/Total Sizes : count 20 avg 317.45 +/- 4.295 min 316 max 336 sum 6349
All done 20 calls (plus 0 warmup) 30.772 ms avg, 48.2 qps